See How Your Town Voted For Governor
I'm always fascinated by these breakdowns of voters.
NJ Advance Media put together a map that shows how many votes were cast in each town across NJ, how many voted for Phil Murphy, how many voted for Kim Guadagno, and how many voted for "Other."

One of my favorite things is when you look at towns like Walpack. I notice how dark red it is, and decide to hover to check the stats. An overwhelming victory for Guadagno, getting 83.3% of the vote...then I see that literally six people in that town voted, with five opting for Guadagno, 1 for "other" and 0 for Murphy. SIX PEOPLE! Overall across the state, only 35-37% of registered voters headed to the polls on Election Day, the lowest turnout ever for a gubernatorial election.
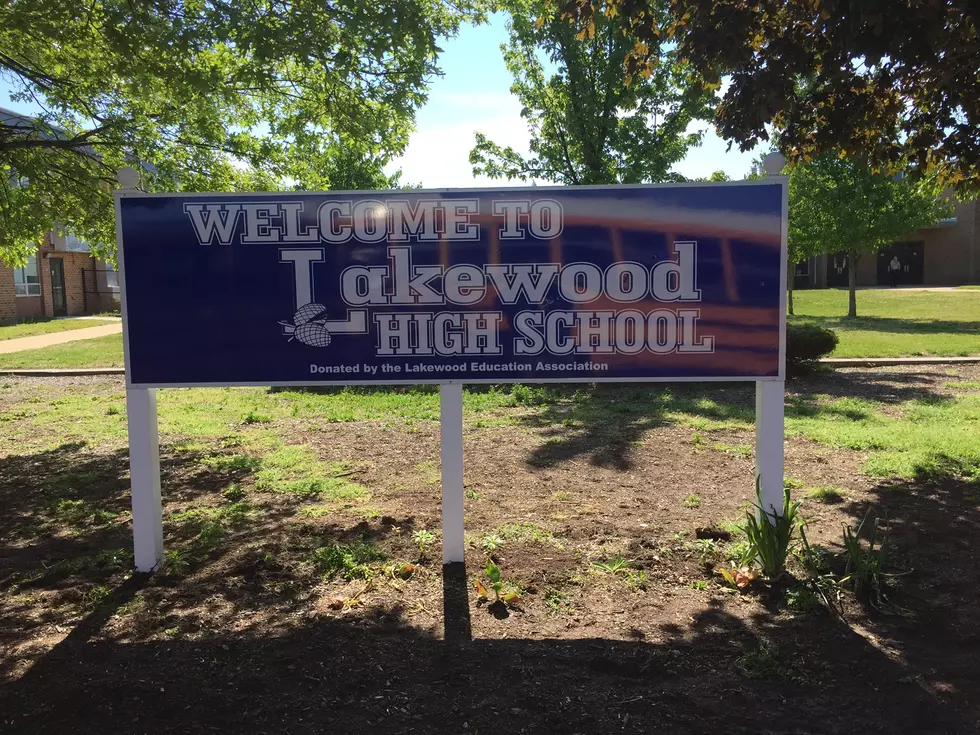
Lakewood, where I live, had an extremely tight race. with Murphy getting 5.704 votes compared to Guadagno's 5,616.
It's not surprising that the map looks nearly identical to the one that we posted after the Presidential Election in 2016. Most of the towns and counties lean red, but there is that diagonal strip that is heavily populated and heavily blue.
You can check out NJ.com for a more in-depth look of every town in New Jersey.
More from 105.7 the Hawk:
More From 105.7 The Hawk